📊 Reports now explain themselves
You open the report, see "first response time: 4min12" and can't tell whether it counts weekends, whether it counts automated messages, or why the team number doesn't match the sum of the agents. Now the screen itself answers.
What changes
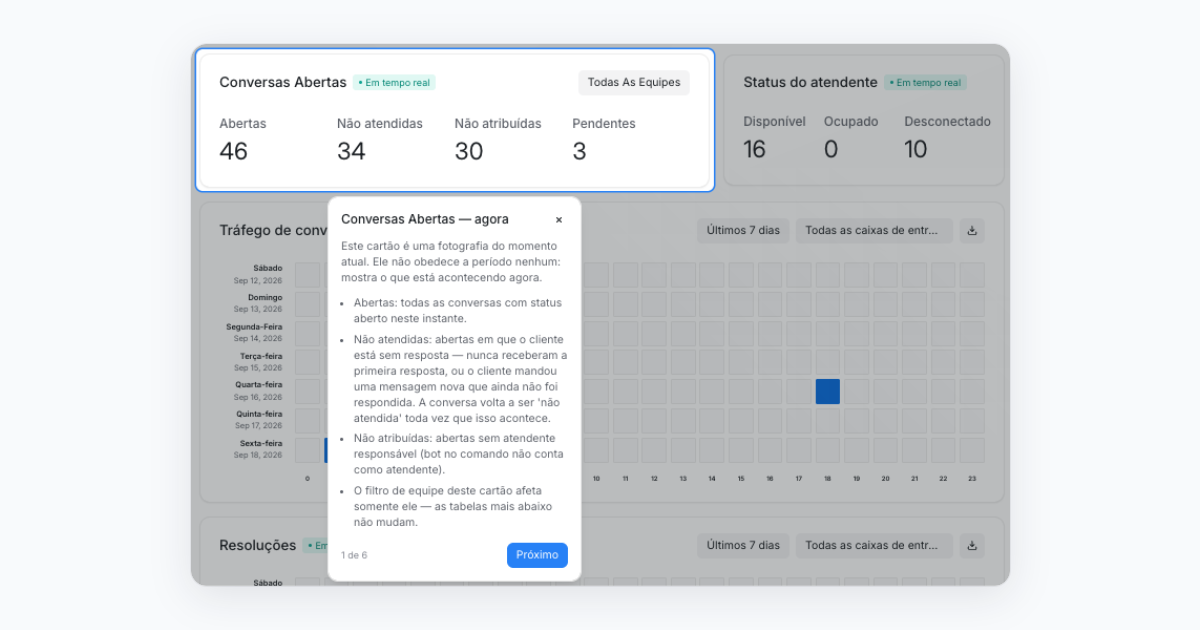
Every NChat report screen now has an "Understand the metrics" button at the top. Click it and the screen dims and highlights one metric at a time, with the explanation next to it: what it measures and how it is counted. You move at your own pace with the previous and next buttons, and close it whenever you want. The tour never opens on its own.
Where it is
On 13 report screens: Overview, Conversations, CSAT, SLA, Bot, and the Agents, Inboxes, Labels and Teams families.
Benefits
- Understand the main metrics on each screen without opening a ticket
- Read each number the way NChat counts it, with no misinterpretation
- Nothing to configure: once the new version is active, the button is there for administrators and anyone with reports permission
Availability
Understand the metrics is part of the new version of NChat (V4). The update is not automatic: contact us through NDesk and our implementation team will activate the new version on your account.
Best regards, The New Byte Team